
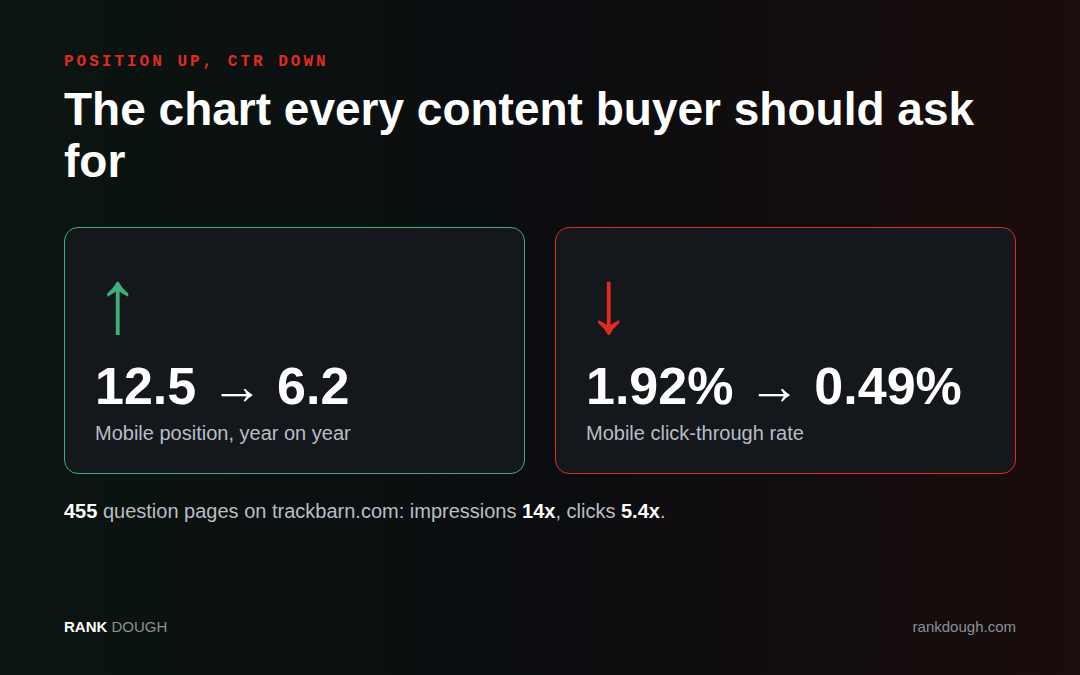
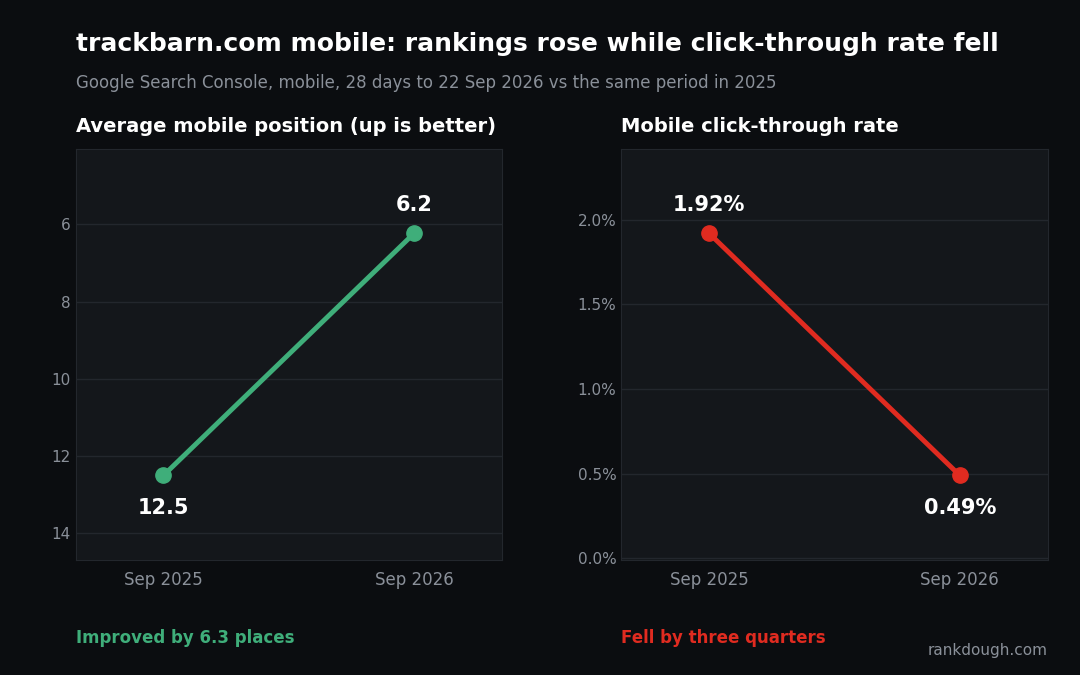
Every content buyer should ask for the position-versus-CTR chart, because on trackbarn.com mobile position improved from 12.5 to 6.2 while click-through rate fell from 1.92% to 0.49%.
TL;DR
Over six months I published 455 question pages on trackbarn.com, and impressions rose from 113,000 to 1.58 million a month while the new pages settled at position 6.5 with a 0.36% click-through rate. On mobile, site-wide position improved from 12.5 to 6.2 while CTR fell from 1.92% to 0.49%. That pair, position up and CTR down, is the chart every content buyer should ask for and almost nobody does.
How this was researched
The work behind the numbers, so you can judge them for yourself.
EFFORT
Six months of Search Console
455 question pages published over six months, compared year on year in Search Console by page, query, device and country.
ORIGINALITY
Client data, not a survey
The chart comes from one client’s own Search Console. Nobody else has it.
SKILL
Run by an SEO, not a tool
Written by Roman Sadowski, who built the pages and reports this pair of numbers to clients every month.
ACCURACY
What it doesn’t prove
The fall in click-through rate likely comes from search features taking clicks, but the cause isn’t isolated. One site.
What does the position-versus-CTR chart show?
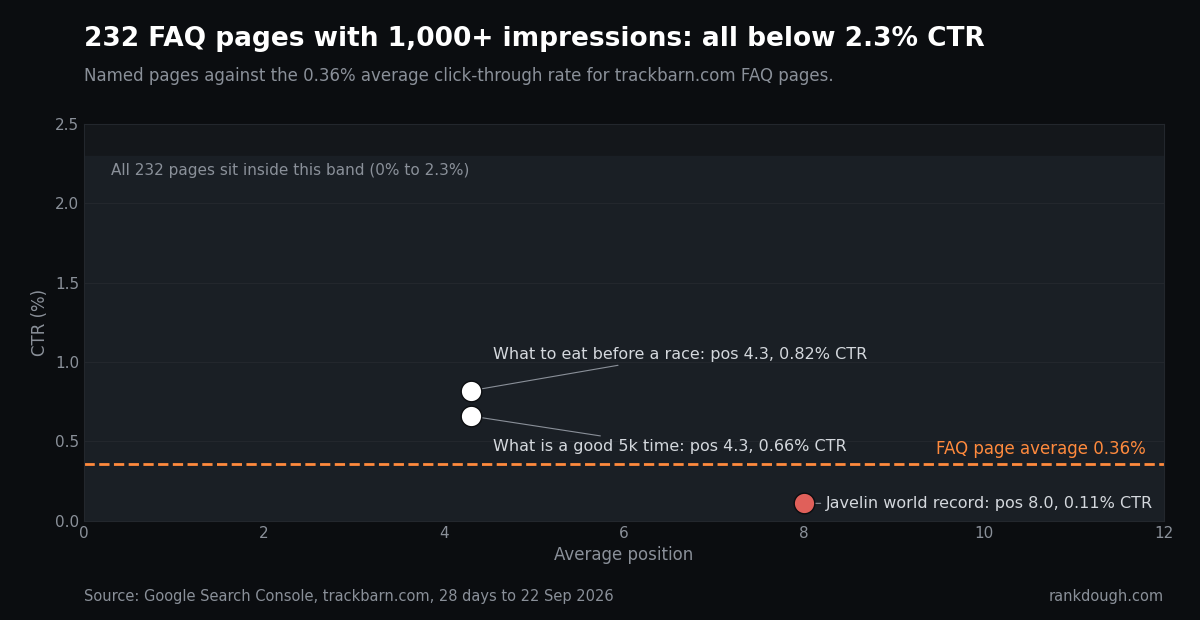
On trackbarn.com, the best-performing new page, “what is a good 5k time for cross country”, ranks at position 4.3 and earned 38,847 impressions in 28 days. It received 255 clicks, a 0.66% CTR.
Historic industry benchmarks put position 4 at 5% to 8%. The page earns roughly one tenth of that.
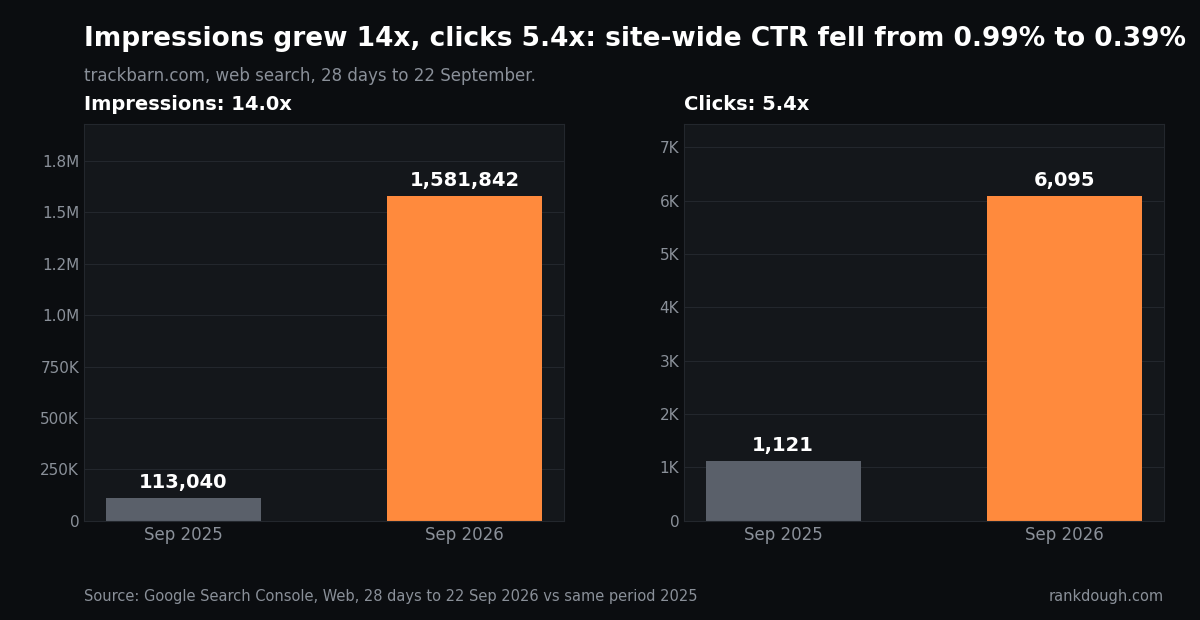
Site-wide the same pattern holds. Across 455 new pages, 1.30 million impressions produced 4,675 clicks.
Mobile position improved by six places over the year while mobile CTR fell by three quarters. Rankings got better. Clicking got rarer.
- Impressions, last 28 days: 1,581,842 (same period 2025: 113,040)
- Clicks, last 28 days: 6,095 (same period 2025: 1,121)
- New pages: 455, average position 6.5, CTR 0.36%
- Mobile: position 12.5 to 6.2, CTR 1.92% to 0.49%
Source: Google Search Console, Web, 28 days to 22 September 2026 versus the same period in 2025.
Why does CTR fall when rankings rise?
A page written to be retrieved opens with a one-sentence answer that contains a number. That is the rule every page in this programme follows, and it is why the pages reach page one inside 60 days without link building.
Google’s answer features reward the same structure and display the answer above the results. The reader gets what they searched for without visiting the page.
Rising position with falling CTR is the signature of that absorption. Which feature is doing it on each query, AI Overview, People Also Ask or a featured snippet, I confirm per query with citation tracking before I report it as fact.
Treat the mechanism here as a working hypothesis. The CTR collapse itself is measured.
What does the pair tell you that a traffic report cannot?
A traffic report says clicks rose 5.4 times. True, and incomplete. The position-versus-CTR pair says the programme now has two kinds of page:
- Pages where the reader still clicks: race-day nutrition, gear questions, anything with a next step the SERP cannot supply. “What is good to eat before a cross country race” sits at 4.3 with 0.82% CTR, more than double the programme average.
- Pages where the SERP answers: definitions, distances, rules. These rank, get read, and send nobody to the site. “What is the javelin world record” has 58,339 impressions and 67 clicks.
The second group is not wasted. It is a citation asset: the brand appears in the answer and in AI systems that train on and cite the same pages. It has to be measured as one, with citation counts and branded search, not with clicks.
How do I plan content because of this?
- Score buyer distance before writing. How many decisions sit between the searcher and the client’s product? A parent asking how far middle-school cross country runs is several decisions from a vaulting pole. A runner asking what to eat before a race is one decision from spikes and gels.
- Check the SERP for an existing answer feature. If an AI Overview already answers the query, the page needs something the Overview cannot give: a calculator, a price table, a sizing tool, a booking path. If it cannot have one, it is a citation asset and gets planned and reported as such.
- Assign the conversion element before drafting. A block the reader needs to finish the task, placed where the task ends. Not a call to action appended at the bottom.
- Keep the retrieval structure. Direct answer with numbers first, atomic sections, one table, sources, FAQs. That is what earns position 6.5 across 1.3 million impressions. Removing it to “win back clicks” loses the ranking and the citation.
What should you ask before you pay for content?
- Show me position and CTR per page, side by side, over 12 months. If nobody has looked, nobody knows where the clicks went.
- Which pages send clicks to product or service pages, and how many? Impressions are a leading indicator, not the result.
- How are the pages that rank but do not click being measured? If the answer is “they are not”, the report is missing half the value.
FAQ
What CTR should I expect at position 3 to 6 on informational queries in 2026?
On trackbarn.com, 0.3% to 0.7%. That is roughly a tenth of the pre-2025 benchmarks for those positions. Plan on it and measure citations alongside clicks.
Does answer-first content still make sense if it lowers CTR?
Yes. It is what earns the ranking and the citation. The fix is choosing which queries get a page, not removing the structure.
How do I tell whether AI Overviews are taking my clicks?
Chart position and CTR per page. Rising position with falling CTR is the tell. Confirm per query with citation tracking on your top 20 terms.
Should I delete pages that rank but get no clicks?
Not by default. Check whether they are cited by AI systems and whether branded search rose. Delete only pages that neither click nor get cited.
How fast do question pages built this way reach page one?
Inside 60 days on trackbarn.com, with no link building. 121 of the 455 pages earn 10 or more clicks a month.
Sources
- Google Search Console, trackbarn.com, Web, last 28 days to 22 September 2026 versus same period 2025 (Pages, Queries, Devices, Countries reports)
